See what's under the hood.
Setup
If you haven’t configured MAMP to use Xdebug yet then you can do so by reading this quick article.
In addition, add the following just under zend_extension.
  xdebug.remote_autostart=1
  xdebug.remote_enable=1
  xdebug.remote_port=9000
  xdebug.remote_host=127.0.0.1
  xdebug.remote_connect_back=1
  xdebug.idekey=PHPSTORM
It should be noted that Xdebug should not be on your production server and enabling the remote_connect_back flag is also not recommended for publicly accessible staging servers also.
By default, PHPStorm will expect to connect to Xdebug on port 9000.

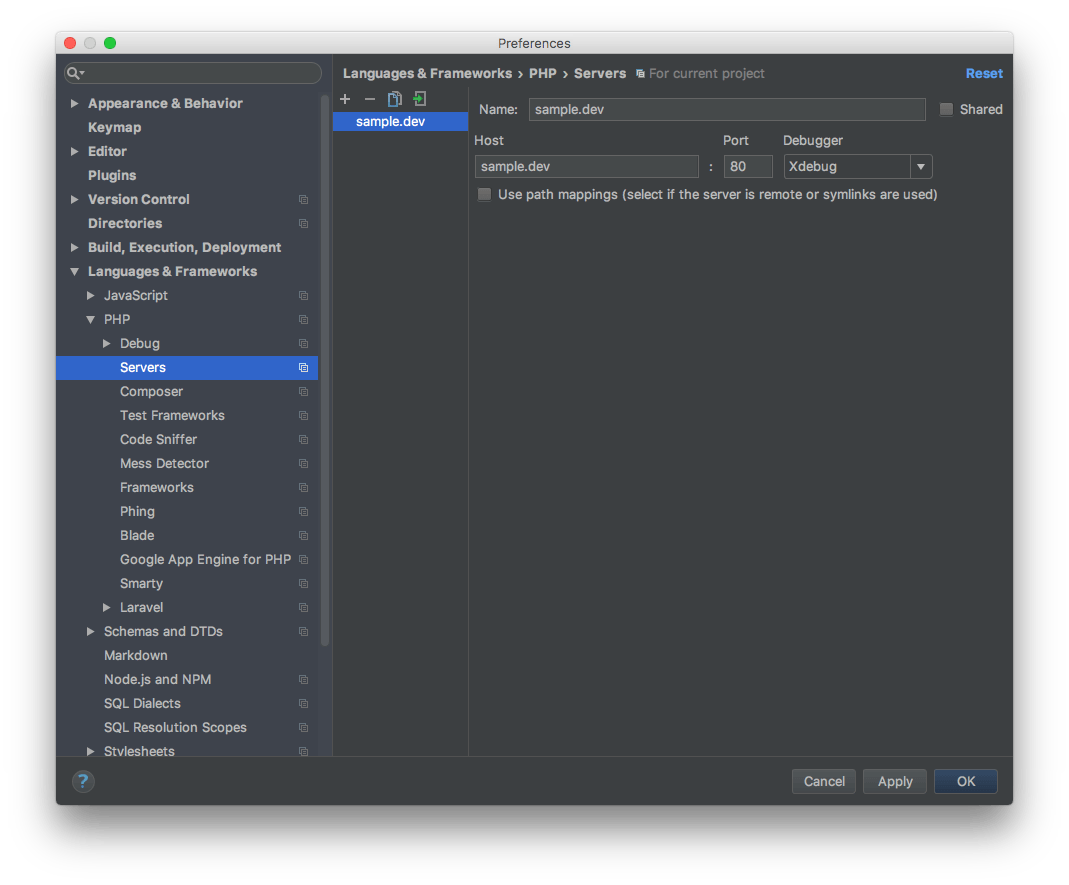
Confirm that you have Xdebug selected for your server.

Giving it a try.
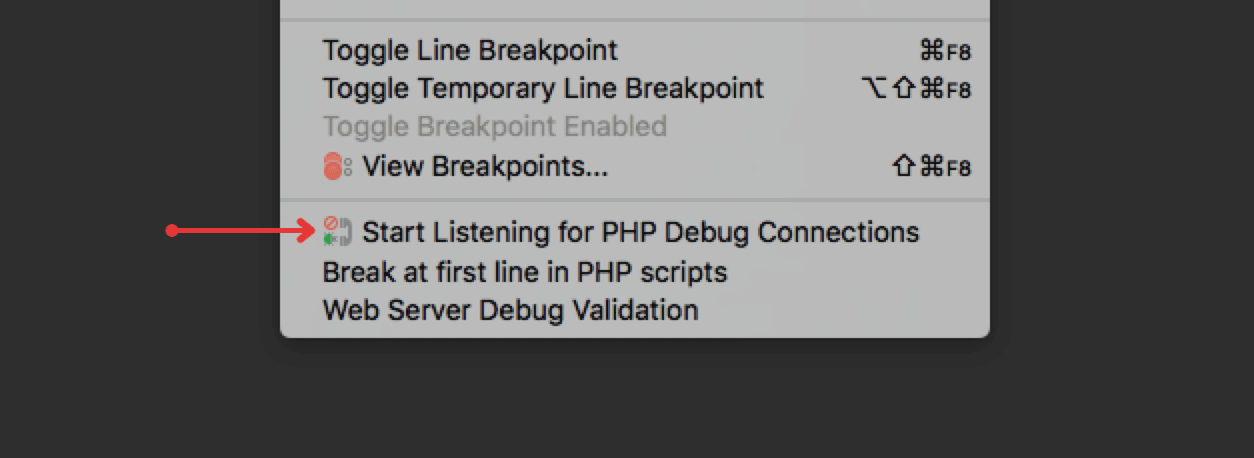
Next, Enable PHP Debugger connections by clicking on the Phone under Run / Start Listening for PHP Debugger Connections.
And because of our local configuration that will allow for remote enable, remote auto start, we don’t need to go set up any other configurations with PHPStorm.
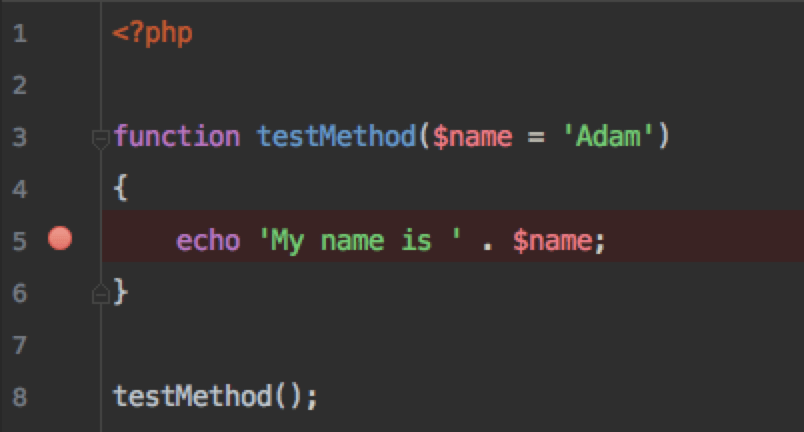
Now click on the gutter near the line numbers to add a breakpoint, this will tell Xdebug to pause and allow you to step through your code execution.

Now if you head over to your browser and reload the project may be prompted to accept the debugger connection.

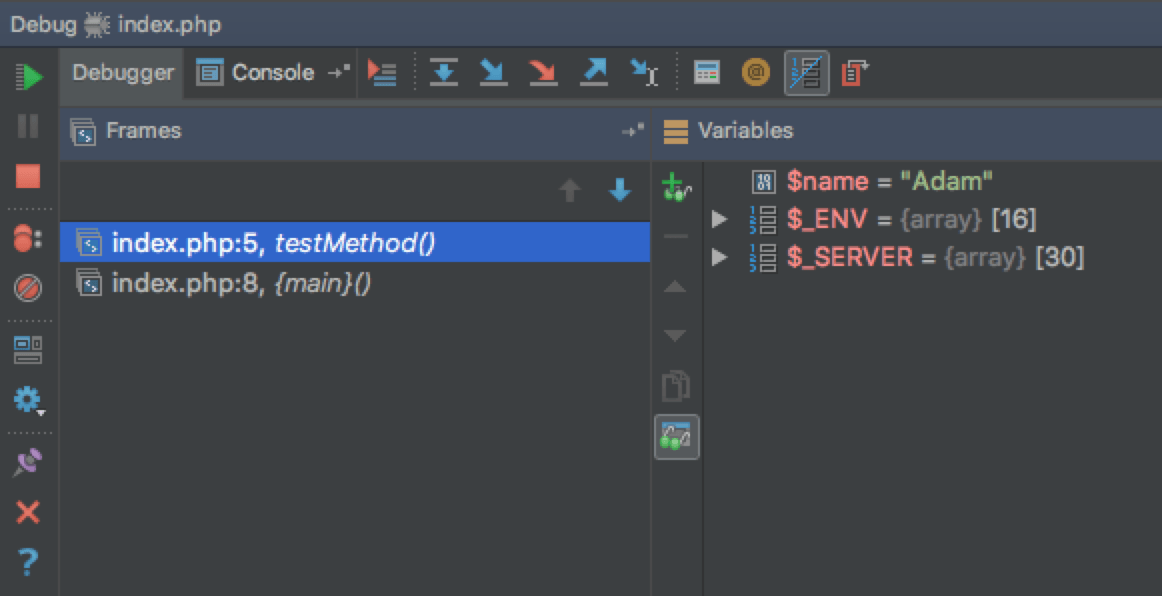
You will be able to see the debug view, and environmental variables. Granted this is an oversimplified view.
But you get the point.
I personally don’t debug all that much but find it can be useful in WordPress when you might be trying to track down hooks, filters, or actions.
Further reading:

